
A Gantt chart is a diagram that represents tasks in form of horizontal bars. Unfortunately, Excel does not have ready-made templates that can be used to construct a Gantt chart in excel. However, the user is prompted to construct Gantt in Excel from scratch. In Excel, one can comfortably construct Gantt charts using the Bar features present.
Additionally, this process involves workarounds that may be confusing to a new user. Below are the steps followed when constructing Gantt chart using Excel:
1. Open the Excel application and click the "New" to create a new document.
2. Firstly, you need to create a table of data that will be later converted to a Gantt chart. For instance, a Gantt chart may have a start date, end date, or several days and the title of the task.

3. Once you're done with adding your details to the project table, click the Insert tab on the top part of the page.
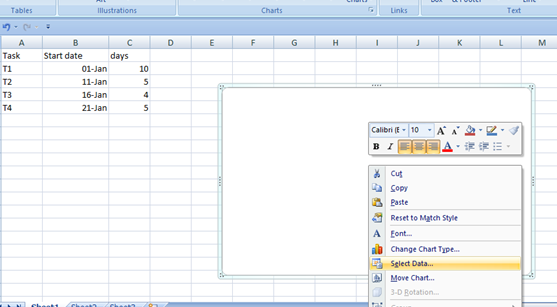
4. On the insert section, navigate to the "Charts section" and click on the "Bar" button. Then, select the 2-D stacked bar by clicking on it. A blank chart appears on the screen.

5.Right-click on the blank menu displayed to open a side-view setting. On the side-view setting displayed, click on the "Select Data" button.
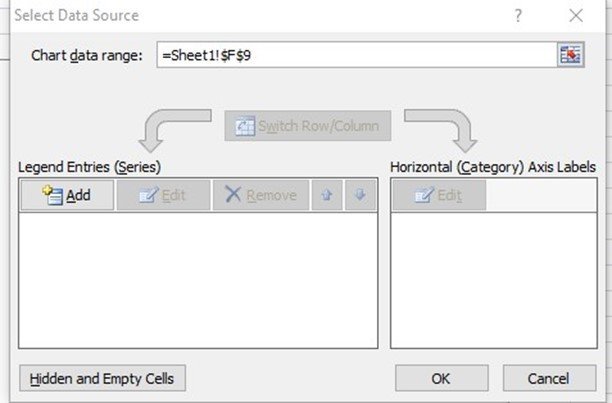
6.A "Select Data Source" dialogue box pops up. On this dialogue box, click on the "Add" button.
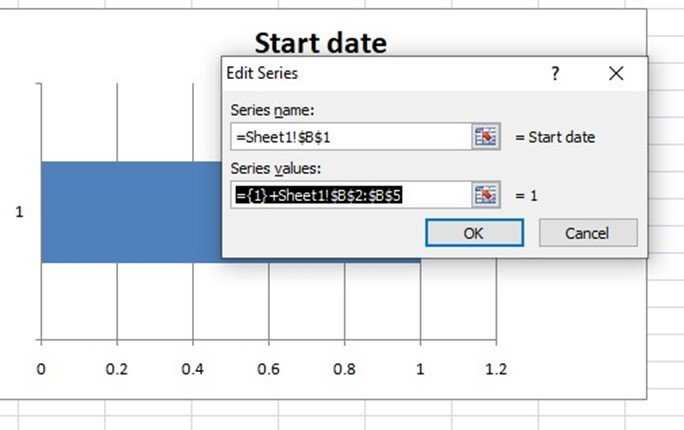
7. Edit the "Edit Series." Firstly, you need to change the series name, click on the box below the Series name section, and highlight the cell that contains the title "Start date." Then, click on the "Series Values" section and highlight all the values below the "Start date column" on your project table. Lastly, hit the "Ok" button.
8. After clicking the "Ok" button you will back to the "Select Data Source" dialogue box. Once again, hit the "Add" button. Repeat the above process and add the column that contains the No. of days.

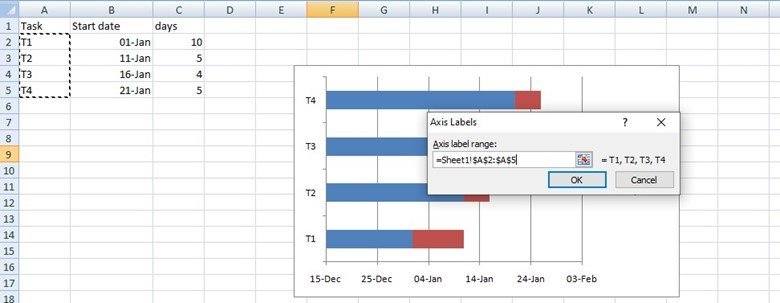
9. Now you have a chart that has two items in the same row. At this point, edit the Horizontal part of your Gantt chart. Still, on the "Select Data Source" dialogue box, click the "Edit" button under the "Horizontal Axis label" section.
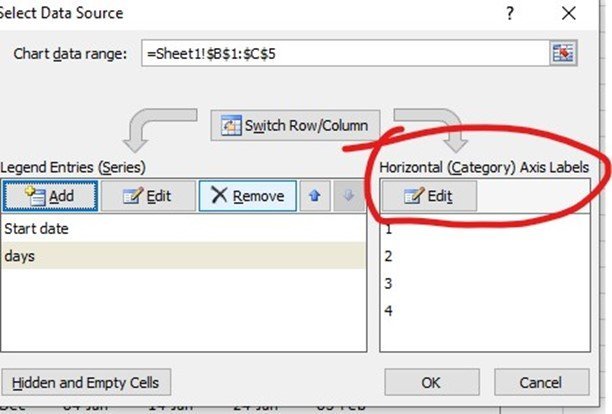
10. On the new dialogue box displayed, highlight all the items under the "Task" column on your project Table and then click the "Ok" button.
To edit the chart to look like a chart Gantt chart
Here are the steps followed;
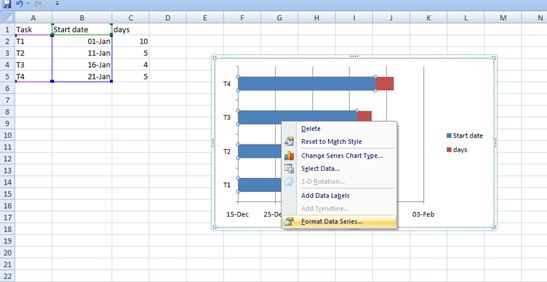
1. Firstly, get rid of the bars that were made from the start date column (the one with the blue color). You can achieve this by, right-clicking on the section with bars, and then select the "Format Data Series" button.
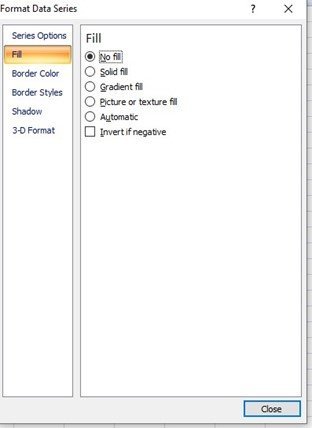
2. On clicking, A format axis pane opens on the right side of the screen.
3. On this screen, click on the "Fill" button and then toggle on the "no fill" button.
4. Your Gantt is now complete. Go ahead and save it on your PC.